Risk Parity Momentum Daily Report
Market data through 2026-09-04 | Forward positions through 2026-09-07
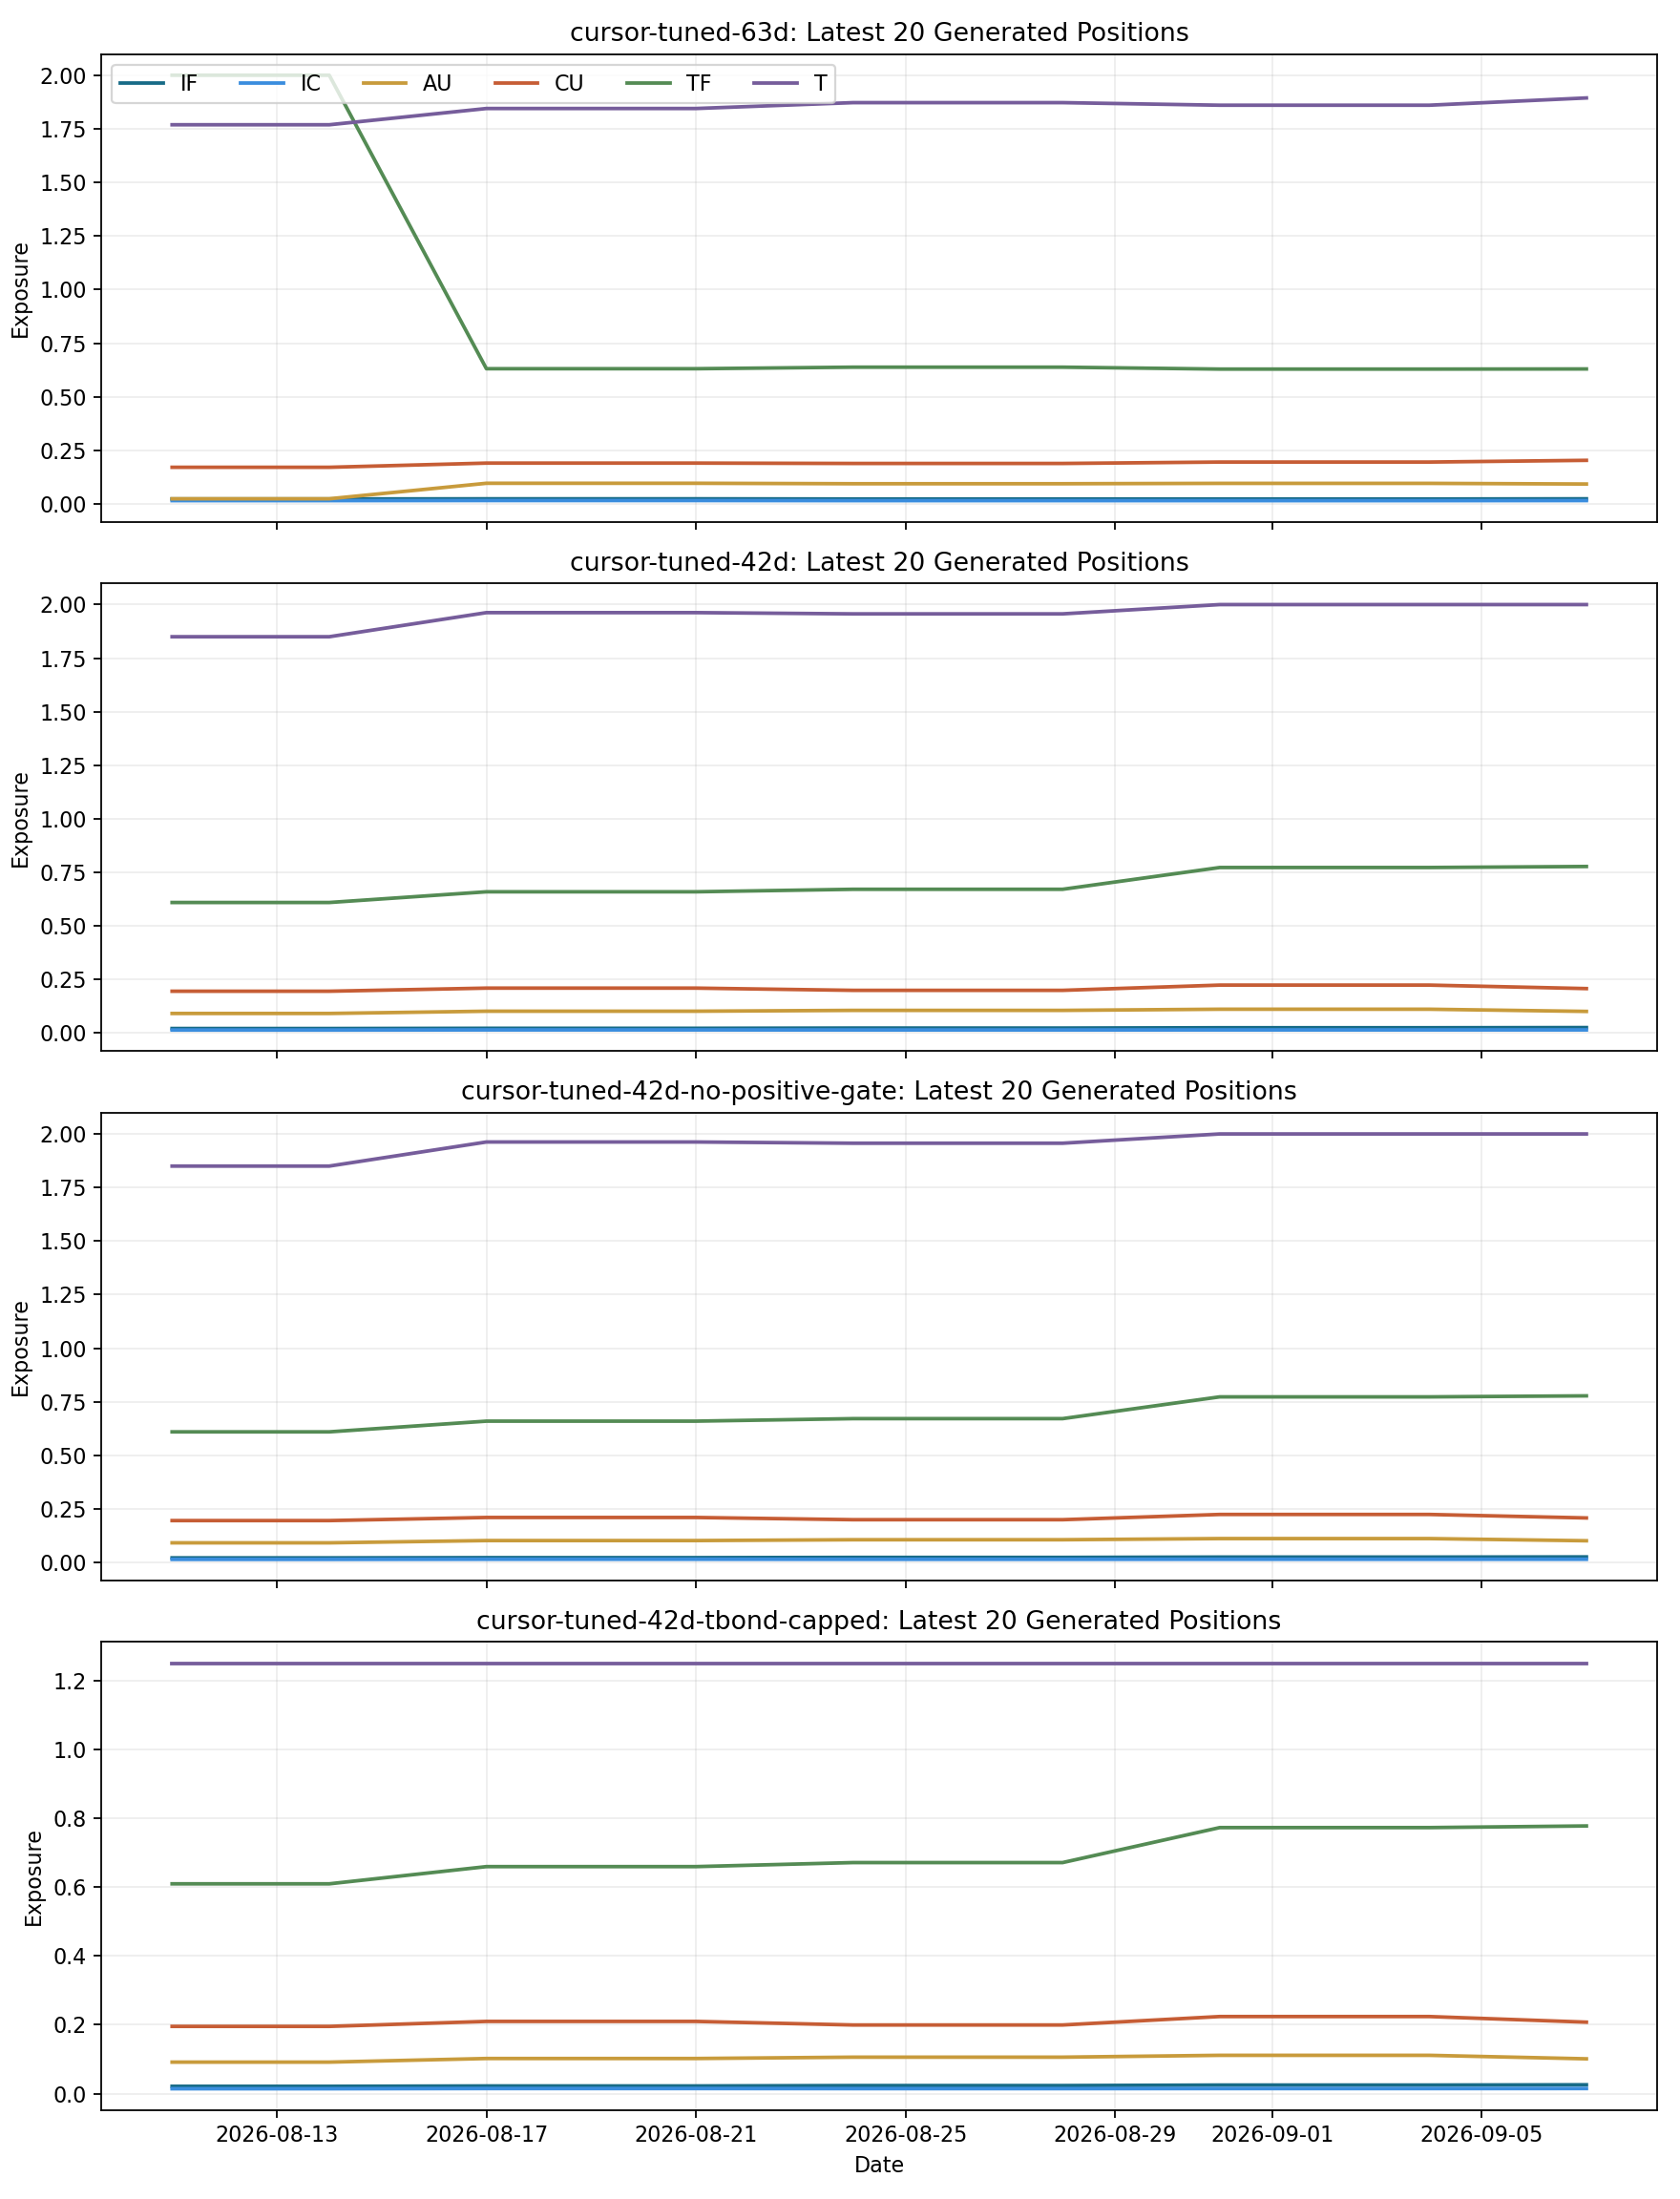
Latest Forward Positions
| Asset | Signal Continuous Contract | Executable Contract | Latest Settle | 63d Exposure | 63d Lots | 42d Exposure | 42d Lots | 42d-no-positive-gate Exposure | 42d-no-positive-gate Lots | 42d-tbond-capped Exposure | 42d-tbond-capped Lots |
|---|
| IF | IFZL.CFE | IF2609 | 4,536.000 | 2.43% | 2 | 2.57% | 2 | 2.57% | 2 | 2.57% | 2 |
| IC | ICZL.CFE | IC2609 | 7,604.800 | 1.61% | 1 | 1.48% | 1 | 1.48% | 1 | 1.48% | 1 |
| AU | AUZL.SHF | AU2610 | 970.820 | 9.33% | 10 | 10.11% | 10 | 10.11% | 10 | 10.11% | 10 |
| CU | CUZL.SHF | CU2610 | 109,110.000 | 20.38% | 37 | 20.76% | 38 | 20.76% | 38 | 20.76% | 38 |
| TF | TFZL.CFE | TF2612 | 106.435 | 63.01% | 59 | 77.76% | 73 | 77.76% | 73 | 77.76% | 73 |
| T | TZL.CFE | T2612 | 109.430 | 189.41% | 173 | 200.00% | 183 | 200.00% | 183 | 125.00% | 114 |
| Total Exposure | | | | 286.15% | | 312.69% | | 312.69% | | 237.69% | |
Fund notional: CNY 100,000,000. Positions are percentages. Lots are rounded estimates using the latest settlement price and exchange contract multiplier. Signal continuous contracts are used by the model. Executable contracts come from the explicit mapping file; values marked MAPPING REQUIRED must be confirmed before trading. Total exposure may exceed 100% because the strategy uses volatility-targeted leverage.
Recent NAV Performance
| Model | Latest Date | Latest NAV | Previous Peak | Drawdown From Peak | Past Week | Past Month |
|---|
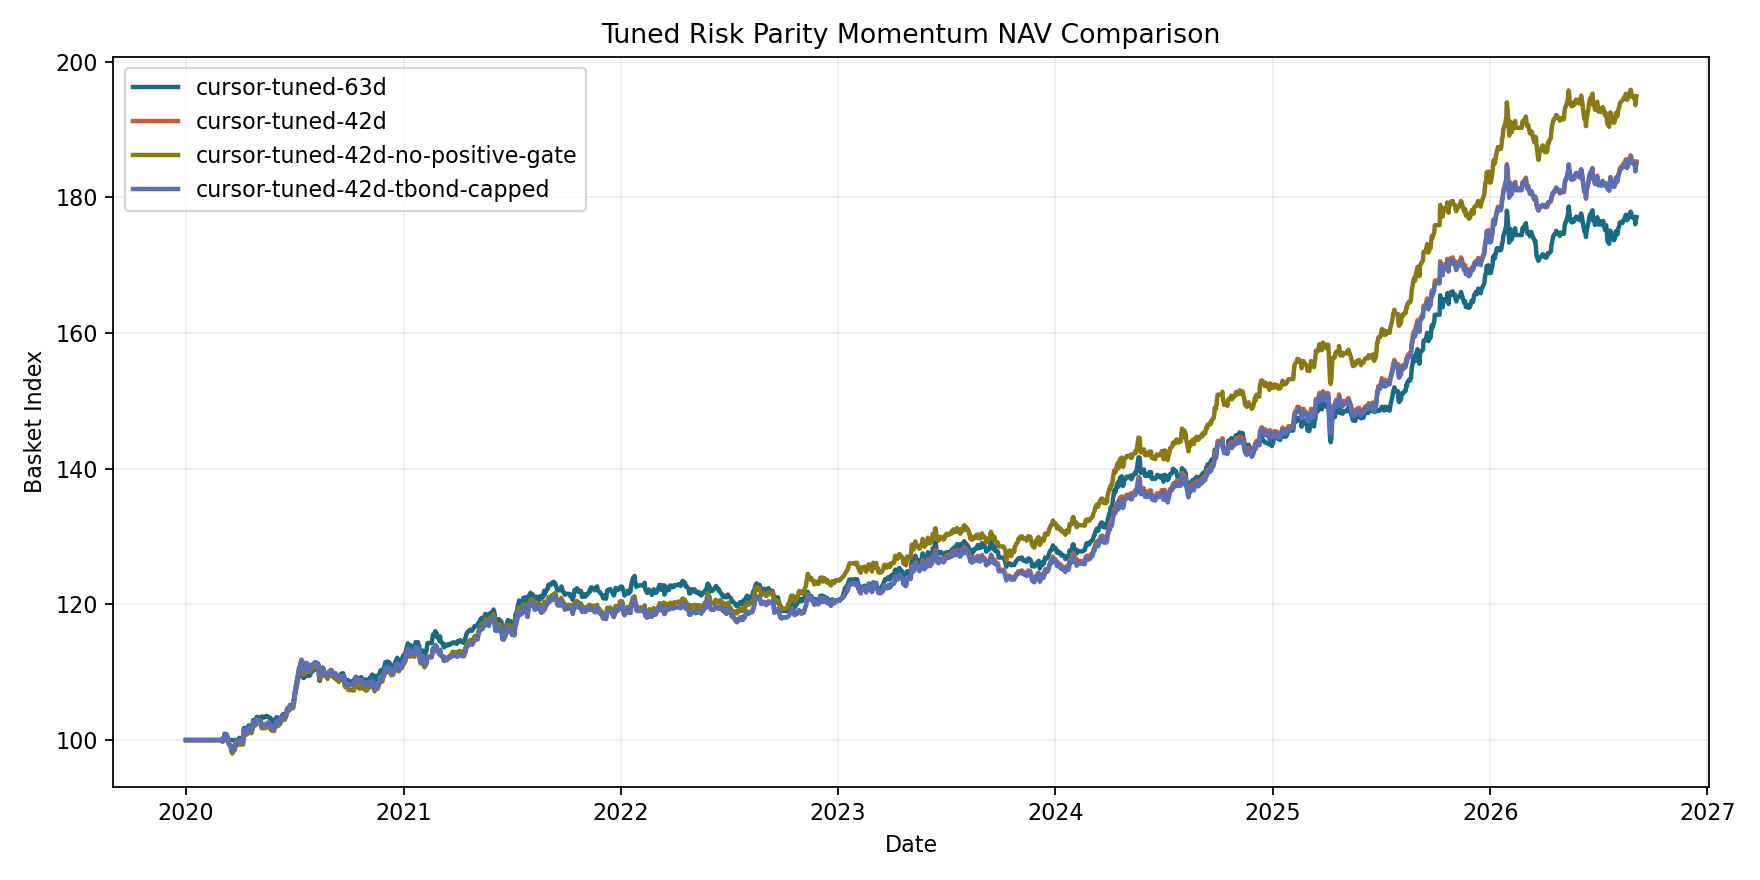
| cursor-tuned-63d | 2026-09-04 | 177.08 | 178.65 | -0.88% | 0.02% | 0.75% |
| cursor-tuned-42d | 2026-09-04 | 185.26 | 186.17 | -0.49% | 0.02% | 0.82% |
| cursor-tuned-42d-no-positive-gate | 2026-09-04 | 194.89 | 195.85 | -0.49% | 0.02% | 0.82% |
| cursor-tuned-42d-tbond-capped | 2026-09-04 | 184.96 | 185.76 | -0.43% | -0.07% | 0.78% |
Past week uses the latest NAV versus 5 trading days earlier. Past month uses the latest NAV versus 21 trading days earlier.
Asset Signal-Window Returns
| Signal Window | Asset | Window Start | Window End | Observed Days | Decay-Weighted Window Return | Compound Cumulative Return |
|---|
| 42d | IF | 2026-07-09 | 2026-09-04 | 42 | -0.07% | -3.30% |
| 42d | IC | 2026-07-09 | 2026-09-04 | 42 | -0.14% | -8.08% |
| 42d | AU | 2026-07-09 | 2026-09-04 | 42 | 0.18% | 6.85% |
| 42d | CU | 2026-07-09 | 2026-09-04 | 42 | 0.14% | 6.19% |
| 42d | TF | 2026-07-09 | 2026-09-04 | 42 | -0.00% | -0.05% |
| 42d | T | 2026-07-09 | 2026-09-04 | 42 | 0.00% | 0.18% |
| 63d | IF | 2026-06-09 | 2026-09-04 | 63 | -0.04% | -1.12% |
| 63d | IC | 2026-06-09 | 2026-09-04 | 63 | -0.07% | -2.01% |
| 63d | AU | 2026-06-09 | 2026-09-04 | 63 | 0.11% | 1.70% |
| 63d | CU | 2026-06-09 | 2026-09-04 | 63 | 0.10% | 5.03% |
| 63d | TF | 2026-06-09 | 2026-09-04 | 63 | -0.00% | 0.07% |
| 63d | T | 2026-06-09 | 2026-09-04 | 63 | 0.00% | 0.31% |
Decay-weighted window return is the momentum signal used by the model for ranking and high/low allocation. It applies the model decay factor to each asset's continuous-futures daily returns over the signal window ending on the latest market-data date, with greater weight on more recent observations. Compound cumulative return is the asset's full-window cumulative return after daily compounding. Both are calculated before exposure sizing and contract-lot rounding.
Next Monday Rebalance Checklist
| Model | Asset | Executable Contract | Previous Effective Date | Latest Effective Date | Previous Exposure | Next Monday Target | Exposure Change | Previous Lots | Target Lots | Lots Change |
|---|
| cursor-tuned-63d | IF | IF2609 | 2026-08-31 | 2026-09-07 | 2.34% | 2.43% | 0.08% | 2 | 2 | +0 |
| cursor-tuned-42d | IF | IF2609 | 2026-08-31 | 2026-09-07 | 2.49% | 2.57% | 0.08% | 2 | 2 | +0 |
| cursor-tuned-42d-no-positive-gate | IF | IF2609 | 2026-08-31 | 2026-09-07 | 2.49% | 2.57% | 0.08% | 2 | 2 | +0 |
| cursor-tuned-42d-tbond-capped | IF | IF2609 | 2026-08-31 | 2026-09-07 | 2.49% | 2.57% | 0.08% | 2 | 2 | +0 |
| cursor-tuned-63d | IC | IC2609 | 2026-08-31 | 2026-09-07 | 1.57% | 1.61% | 0.04% | 1 | 1 | +0 |
| cursor-tuned-42d | IC | IC2609 | 2026-08-31 | 2026-09-07 | 1.47% | 1.48% | 0.01% | 1 | 1 | +0 |
| cursor-tuned-42d-no-positive-gate | IC | IC2609 | 2026-08-31 | 2026-09-07 | 1.47% | 1.48% | 0.01% | 1 | 1 | +0 |
| cursor-tuned-42d-tbond-capped | IC | IC2609 | 2026-08-31 | 2026-09-07 | 1.47% | 1.48% | 0.01% | 1 | 1 | +0 |
| cursor-tuned-63d | AU | AU2610 | 2026-08-31 | 2026-09-07 | 9.63% | 9.33% | -0.30% | 10 | 10 | +0 |
| cursor-tuned-42d | AU | AU2610 | 2026-08-31 | 2026-09-07 | 11.13% | 10.11% | -1.02% | 11 | 10 | -1 |
| cursor-tuned-42d-no-positive-gate | AU | AU2610 | 2026-08-31 | 2026-09-07 | 11.13% | 10.11% | -1.02% | 11 | 10 | -1 |
| cursor-tuned-42d-tbond-capped | AU | AU2610 | 2026-08-31 | 2026-09-07 | 11.13% | 10.11% | -1.02% | 11 | 10 | -1 |
| cursor-tuned-63d | CU | CU2610 | 2026-08-31 | 2026-09-07 | 19.58% | 20.38% | 0.81% | 36 | 37 | +1 |
| cursor-tuned-42d | CU | CU2610 | 2026-08-31 | 2026-09-07 | 22.39% | 20.76% | -1.63% | 41 | 38 | -3 |
| cursor-tuned-42d-no-positive-gate | CU | CU2610 | 2026-08-31 | 2026-09-07 | 22.39% | 20.76% | -1.63% | 41 | 38 | -3 |
| cursor-tuned-42d-tbond-capped | CU | CU2610 | 2026-08-31 | 2026-09-07 | 22.39% | 20.76% | -1.63% | 41 | 38 | -3 |
| cursor-tuned-63d | TF | TF2612 | 2026-08-31 | 2026-09-07 | 62.94% | 63.01% | 0.07% | 59 | 59 | +0 |
| cursor-tuned-42d | TF | TF2612 | 2026-08-31 | 2026-09-07 | 77.28% | 77.76% | 0.48% | 73 | 73 | +0 |
| cursor-tuned-42d-no-positive-gate | TF | TF2612 | 2026-08-31 | 2026-09-07 | 77.28% | 77.76% | 0.48% | 73 | 73 | +0 |
| cursor-tuned-42d-tbond-capped | TF | TF2612 | 2026-08-31 | 2026-09-07 | 77.28% | 77.76% | 0.48% | 73 | 73 | +0 |
| cursor-tuned-63d | T | T2612 | 2026-08-31 | 2026-09-07 | 186.01% | 189.41% | 3.39% | 170 | 173 | +3 |
| cursor-tuned-42d | T | T2612 | 2026-08-31 | 2026-09-07 | 200.00% | 200.00% | 0.00% | 183 | 183 | +0 |
| cursor-tuned-42d-no-positive-gate | T | T2612 | 2026-08-31 | 2026-09-07 | 200.00% | 200.00% | 0.00% | 183 | 183 | +0 |
| cursor-tuned-42d-tbond-capped | T | T2612 | 2026-08-31 | 2026-09-07 | 125.00% | 125.00% | 0.00% | 114 | 114 | +0 |
Next Monday target uses the latest generated forward position. Exposure change compares it with the previous effective model position. Lot changes are rounded estimates for CNY 100,000,000 fund notional and should be checked against actual trading limits, margin and execution constraints before placing orders.
Risk Alerts
cursor-tuned-63d: total exposure is 286.2%, above the 250% review threshold.
cursor-tuned-63d: high single-asset exposure detected: T 189.4%.
cursor-tuned-42d: total exposure is 312.7%, above the 250% review threshold.
cursor-tuned-42d: high single-asset exposure detected: T 200.0%.
cursor-tuned-42d-no-positive-gate: total exposure is 312.7%, above the 250% review threshold.
cursor-tuned-42d-no-positive-gate: high single-asset exposure detected: T 200.0%.
USDCNH New-Regime Observation
| USDCNH New-Regime Observation | Value |
|---|
| Adaptive fair value | 6.6836 |
| Spot vs adaptive fair value | 0.36% |
| Expected USDCNH change: 5 trading days | -0.01% |
| Model-implied probability of USDCNH down: 5 days | 51.17% |
| Walk-forward direction hit rate: 5 days | 63.69% |
| Expected USDCNH change: 20 trading days | -0.32% |
| Model-implied probability of USDCNH down: 20 days | 84.18% |
| Walk-forward direction hit rate: 20 days | 71.65% |
Negative expected USDCNH change indicates an RMB-strengthening bias. Probabilities are model-implied research observations from a short regime window and must not be converted directly into hedge ratios.
Model Parameters
| Model | Data Begin | NAV Begin | Signal | Vol Window | Target Vol | Decay | Rebalance | Forward Days |
|---|
| cursor-tuned-63d | 2020-01-01 | 2020-01-01 | 63d | 63d | 8.00% | 0.98 | weekly | 1 |
| cursor-tuned-42d | 2020-01-01 | 2020-01-01 | 42d | 42d | 8.00% | 0.98 | weekly | 1 |
| cursor-tuned-42d-no-positive-gate | 2020-01-01 | 2020-01-01 | 42d | 42d | 8.00% | 0.98 | weekly | 1 |
| cursor-tuned-42d-tbond-capped | 2020-01-01 | 2020-01-01 | 42d | 42d | 8.00% | 0.98 | weekly | 1 |
NAV Comparison
Drawdown Comparison
Rolling Volatility
Performance Metrics
| Metric | cursor-tuned-63d | cursor-tuned-42d | cursor-tuned-42d-no-positive-gate | cursor-tuned-42d-tbond-capped |
|---|
| NAV | 177.08 | 185.26 | 194.89 | 184.96 |
| Total Return | 77.08% | 85.26% | 94.89% | 84.96% |
| Annual Return | 8.90% | 9.63% | 10.47% | 9.61% |
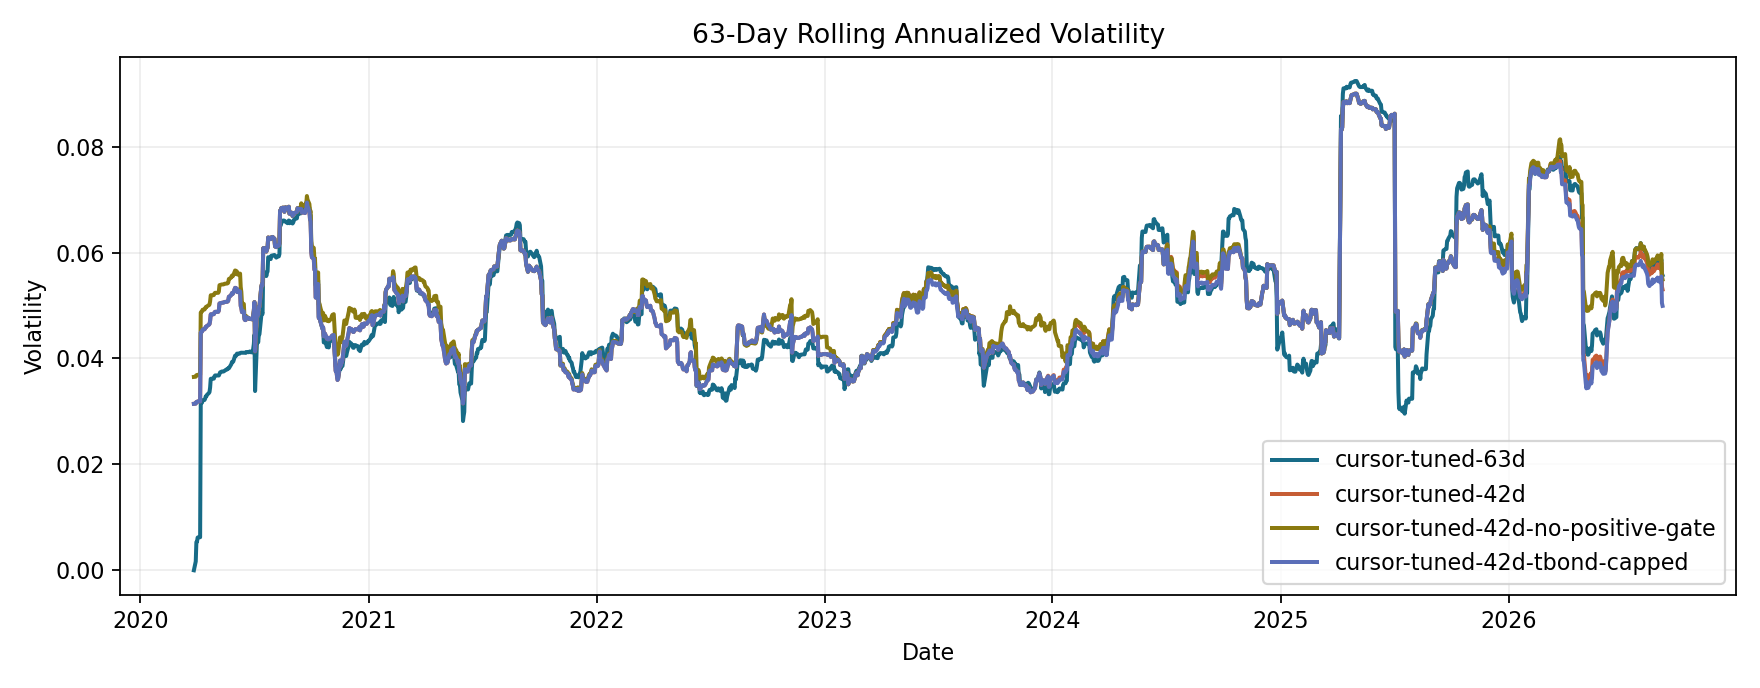
| Annual Volatility | 5.15% | 5.18% | 5.32% | 5.15% |
| Sharpe | 1.73 | 1.86 | 1.97 | 1.87 |
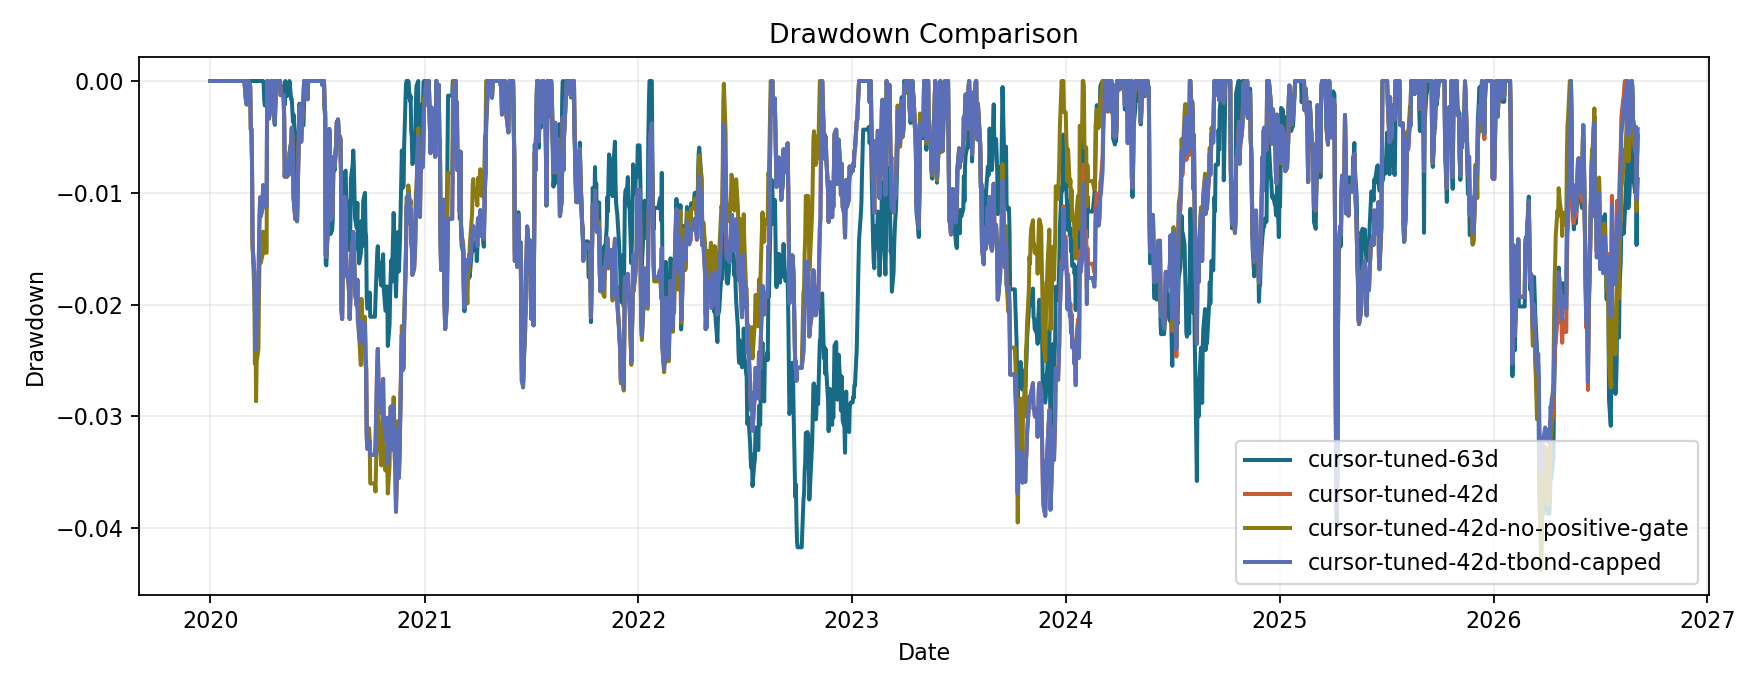
| Max Drawdown | -4.17% | -3.88% | -4.38% | -3.89% |
| Calmar | 2.13 | 2.48 | 2.39 | 2.47 |
| Sortino | 2.16 | 2.45 | 2.60 | 2.45 |
| Positive Days | 50.49% | 51.52% | 51.52% | 51.58% |
| Average Exposure | 147.81% | 154.94% | 169.00% | 151.61% |
| Max Exposure | 402.79% | 395.72% | 407.35% | 345.60% |
Metrics use daily returns through the latest available market-data date. Sharpe assumes a zero risk-free rate.
Annual Returns
| Year | cursor-tuned-63d | cursor-tuned-42d | cursor-tuned-42d-no-positive-gate | cursor-tuned-42d-tbond-capped |
|---|
| 2020 | 12.43% | 11.60% | 11.21% | 11.60% |
| 2021 | 9.05% | 7.52% | 8.32% | 7.52% |
| 2022 | -1.61% | 0.43% | 2.53% | 0.43% |
| 2023 | 6.40% | 5.13% | 6.87% | 4.90% |
| 2024 | 11.98% | 14.65% | 15.25% | 14.60% |
| 2025 | 17.49% | 19.55% | 19.75% | 19.66% |
| 2026 | 4.87% | 6.69% | 6.98% | 6.69% |
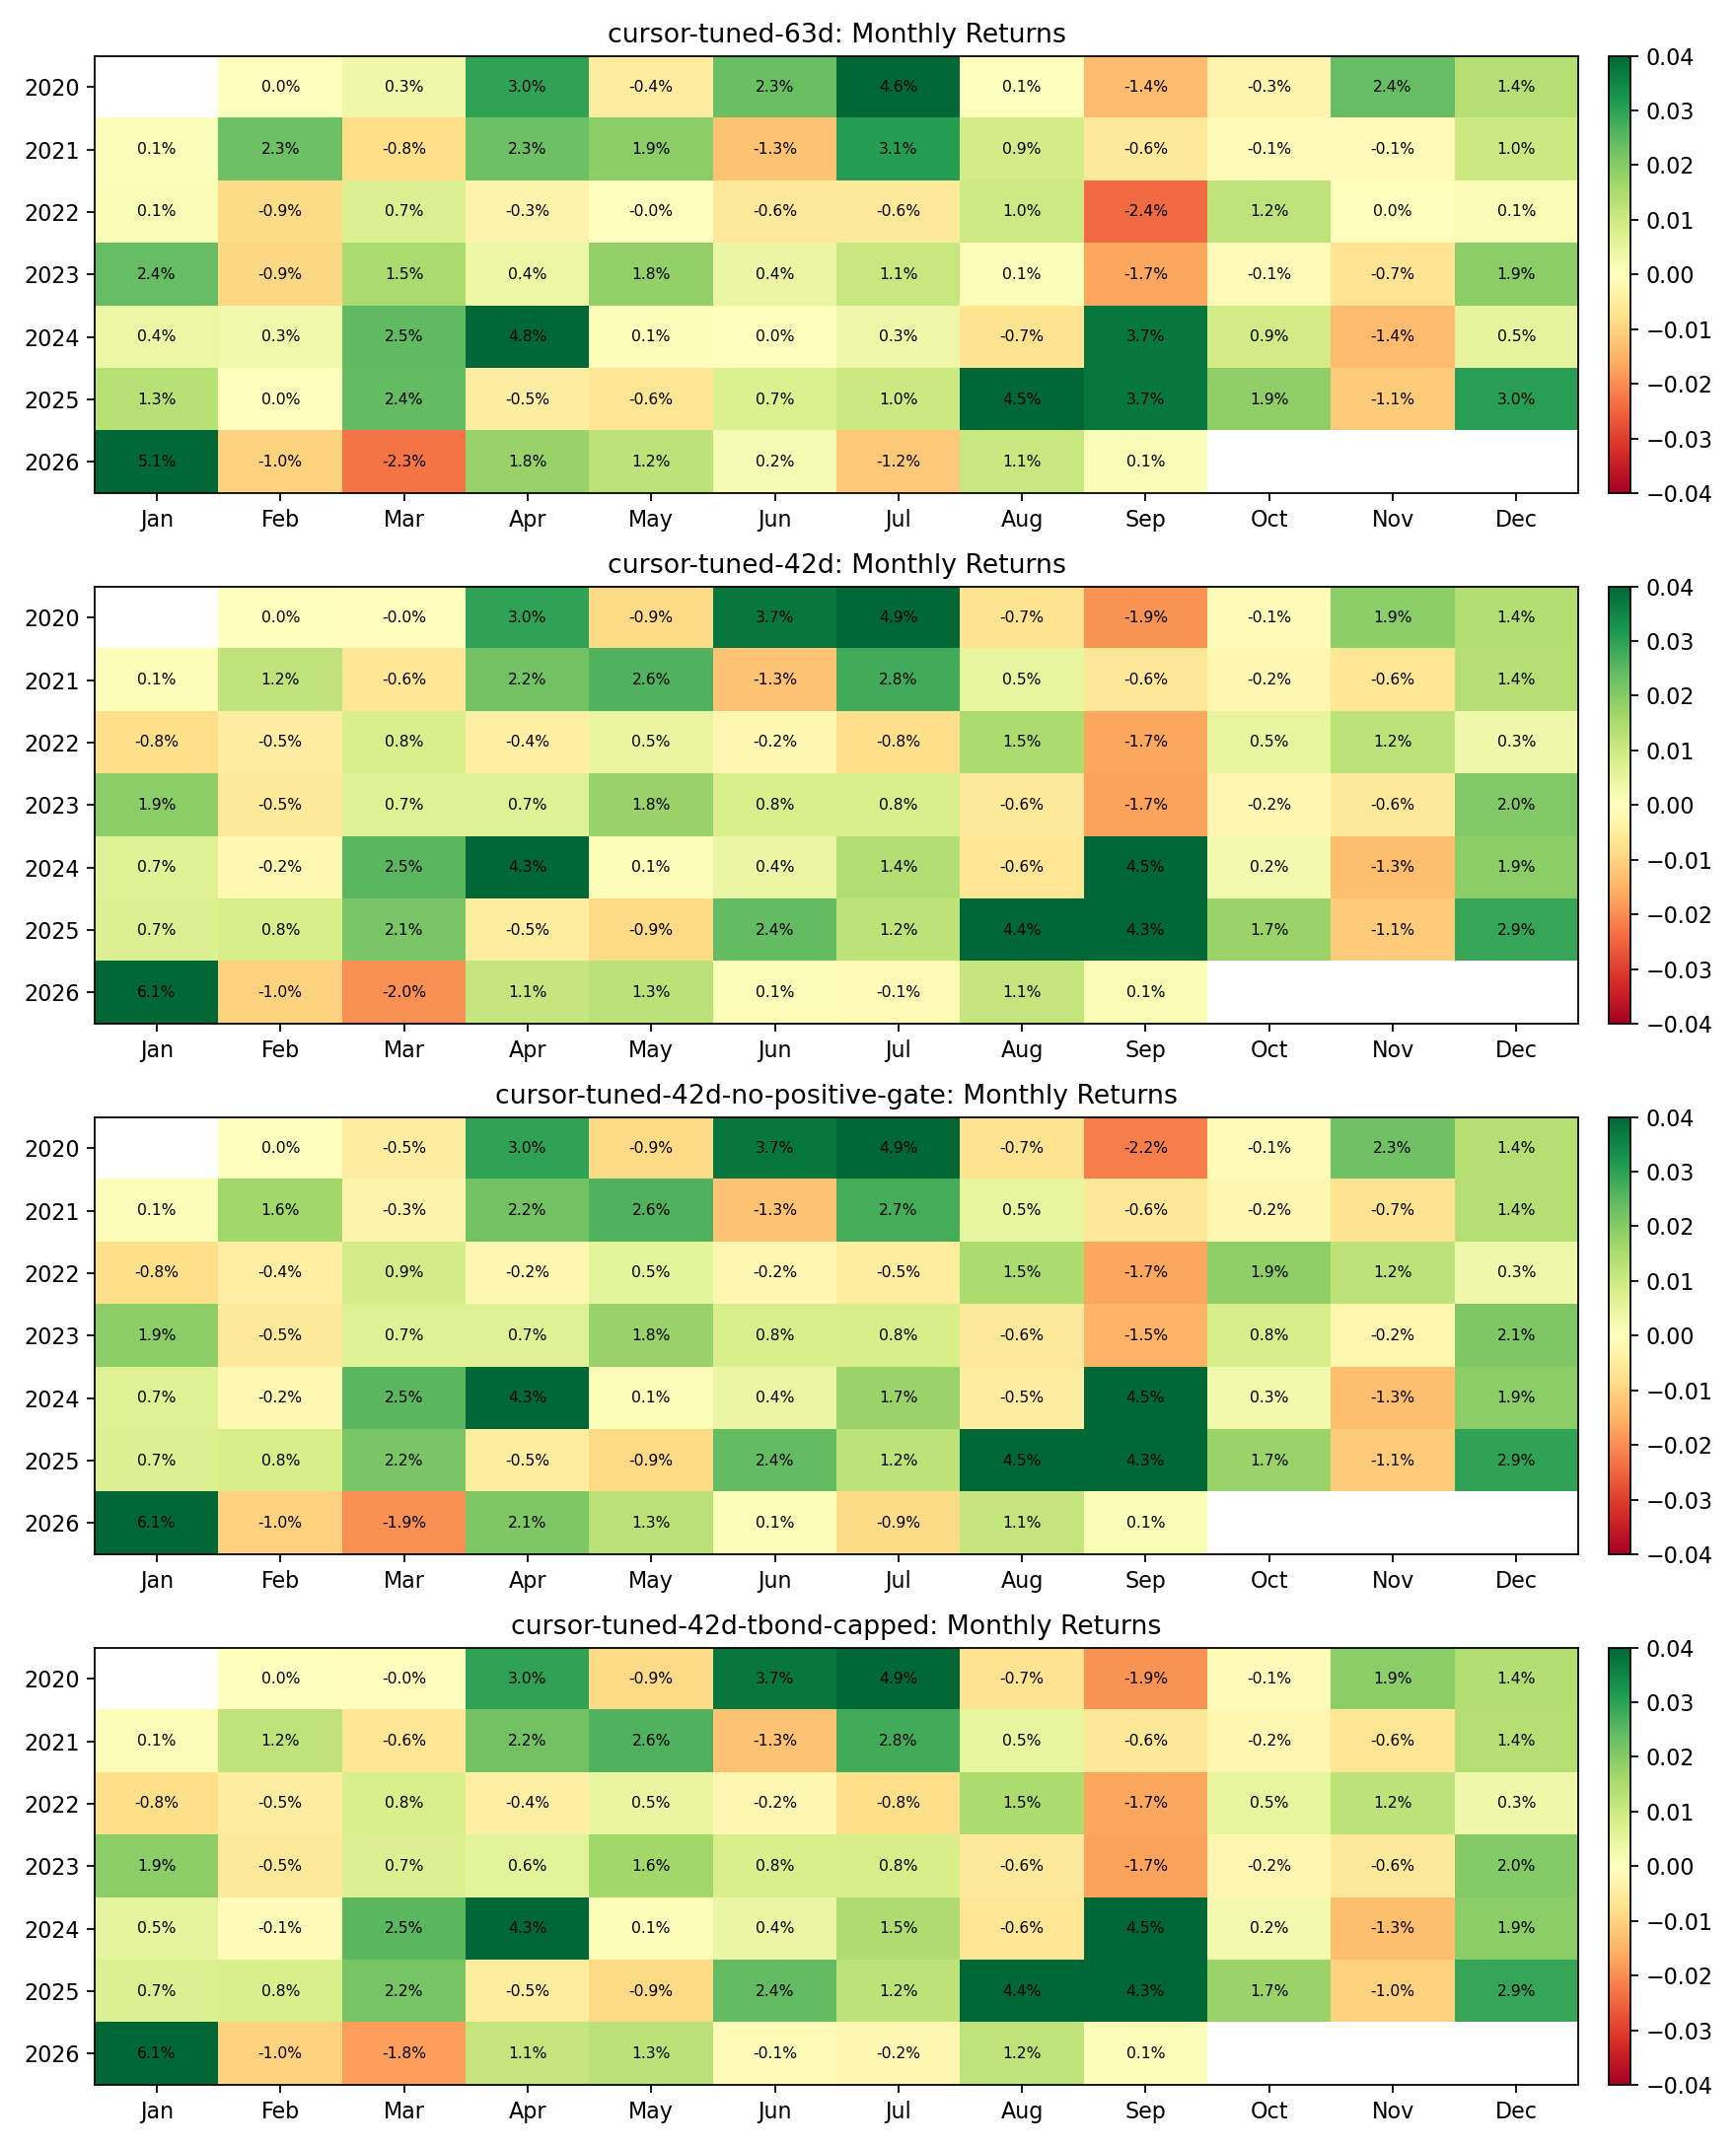
Monthly Returns
Recent Position Changes